
Trent, A renowned Tata group company, has become the top gainer of nifty 50 this year. The stock has rallied over 130%+ this year and 400%+ in the last two years, But what is next? Will the growth continue? Let us try to find the answer through Trent’s fundamental analysis.

Trent Company Overview
Trent Limited is one of India’s leading retail companies, part of the Tata Group, known for its dynamic approach to modern retailing. Established in 1998, the company operates a diverse portfolio of retail formats, including Westside, Zudio, and Star Bazaar, fashion to a wide range of consumer needs.
Key-takeaways
- Trent’s stock has surged over 130% in the past year and an incredible 400% over the last two years.
- Trent has plans to launch 150-200 new Zudio stores and 30-40 Westside stores in FY25.
- Trent has demonstrated exceptional financial performance, with a 68% revenue CAGR and a 101% profit CAGR over the last three years.
- Profit margins and return ratios have shown significant improvement in FY24.
- Despite strong fundamentals, Q2 FY25 results missed market estimates, leading to a 20% drop in stock price.
Trent stores growth
The company’s sales growth has primarily been driven by the performance of its Zudio and Westside stores. With this momentum in mind, let’s take a closer look at the company’s plans for launching new stores in FY25.
| Brands | Stores FY24 | New Stores Launch Expectations |
|---|---|---|
| Zudio | 577 | 150-200 |
| Westside | 226 | 30-40 |
The consistent expansion of stores is expected to drive significant revenue growth for the company in the coming years. Now, let’s explore how was the sales growth in past few quarters.
Annual Trent Fundamentals
This TATA Group company, with its aggressive expansion has grew their sales exceptionally. On an average, the company had 68% growth in their sales in the last 3 years. the below chart will help to understand the growth better.
Sales Growth
Trent Stock Performance
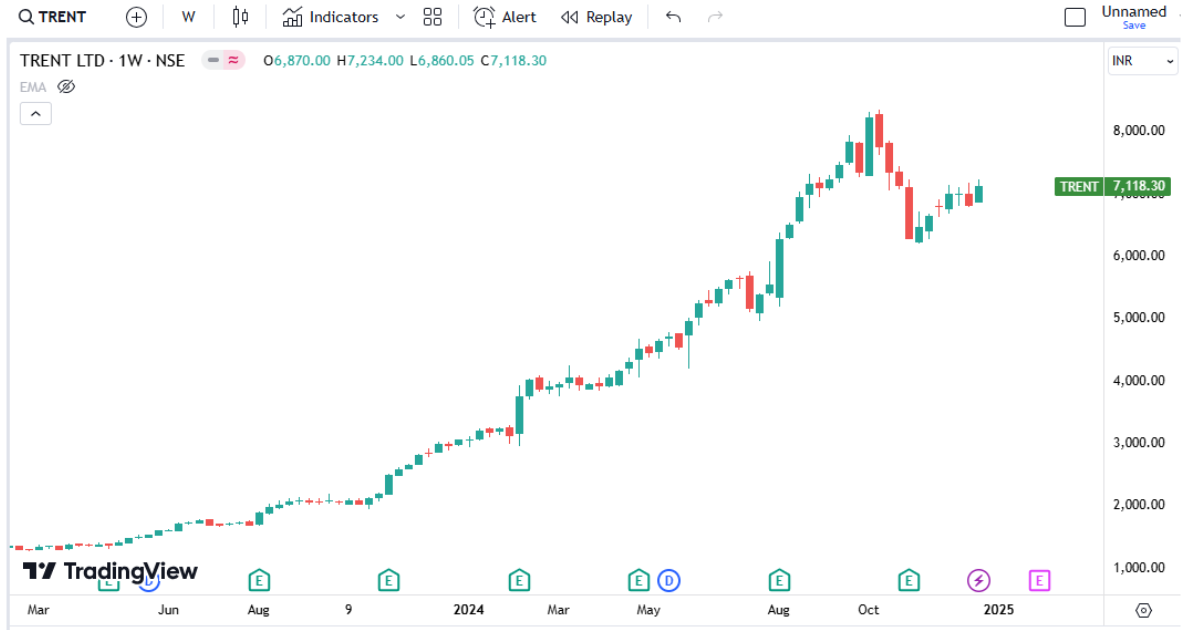
Over the years, Trent has delivered remarkable returns to its investors, gaining over 400% since January 2023 and more than 130% since January 2024. However, recently the stock faced a correction of over 20% from its all-time high, primarily due to missed Q2 earnings estimates. As the stock shows signs of recovery, let’s take a closer look at the impressive returns it has offered to investors over time.
Stock Returns
| Period | Returns |
|---|---|
| 1 Week | 4.20% |
| 1 Month | 3.99% |
| 3 Months | -9.13% |
| YTD | 128.05% |
| 1 Year | 133% |
| 3 Year CAGR | 90% |
Current Stock Details and Valuation
| Particular | Value |
|---|---|
| CMP | 7,118 Rs |
| Market Cap | Rs 2,53,047 Cr |
| 52-Week High | 8,346 Rs |
| 52-Week Low | 2,941 Rs |
| Stock P/E | 186 |
| P/B | 62.21 |
Well, the stock is trading at a higher valuation. However, We cannot deny that the stock price is moving with the company’s amazing growth. At the current state, the Trent stock’s P/E is at 186 while the P/B value is at 62.21.
As of December 27, The stock is trading at a market cap of over 2,50,000 Crore and a price of 7,118. Which is over 1000Rs Below its 52-week High of Rs 8,346. But, are there possibilities of the stock coming back to its all-time high? Let us take a look at what research firms have to say about it.
Trent Stock Target 2025
The recent fall in stock cannot outrule that the Trent Fundamentals are strong. Additionally, The Research firms, are giving buy calls despite missing the estimates of Q2 Results. In early November, Motilal Oswal and Sharekhan gave the share price targets of Rs 8,200 and 8,261. Now we wait to see if stock will come back to its all-time high.
Conclusion
Trent’s impressive growth over the past two years, coupled with strong fundamentals and aggressive expansion plans, positions it as a standout performer in the retail sector. While recent stock corrections raise questions, the company’s robust financial health, consistent profit growth, and strategic store expansion provide a solid foundation for future success. As the market evolves, Trent’s ability to sustain its momentum will be key in determining whether it can reclaim its all-time highs and continue delivering exceptional returns for investors.