One of the most common mistakes traders make is relying solely on short-term time frame charts for analysis. While a short-term chart might show a breakout, a longer time frame could tell an entirely different story. So, how can you effectively use time frames for analysis? Let’s dive in and learn more.
Table of Contents
Key Takeaways :
- Time frames play an important role in trading because different time frames show different price movements and directions.
- Time frames are essential for decision-making for both traders and investors.
- Intraday Time-Frames (e.g., 5-Min, 15-Min, 1-Hour) are used by traders who buy and sell stocks within a day
- Short-term time frames (e.g., 4-Hour, 1-D) are useful for short-term trades who hold the position for a few days or a week.
- Long-term time frames (e.g., 1-Week, 1-Month) are helpful for swing traders and investors who hold stocks for months or years.

What is a Time Frame in Trading:
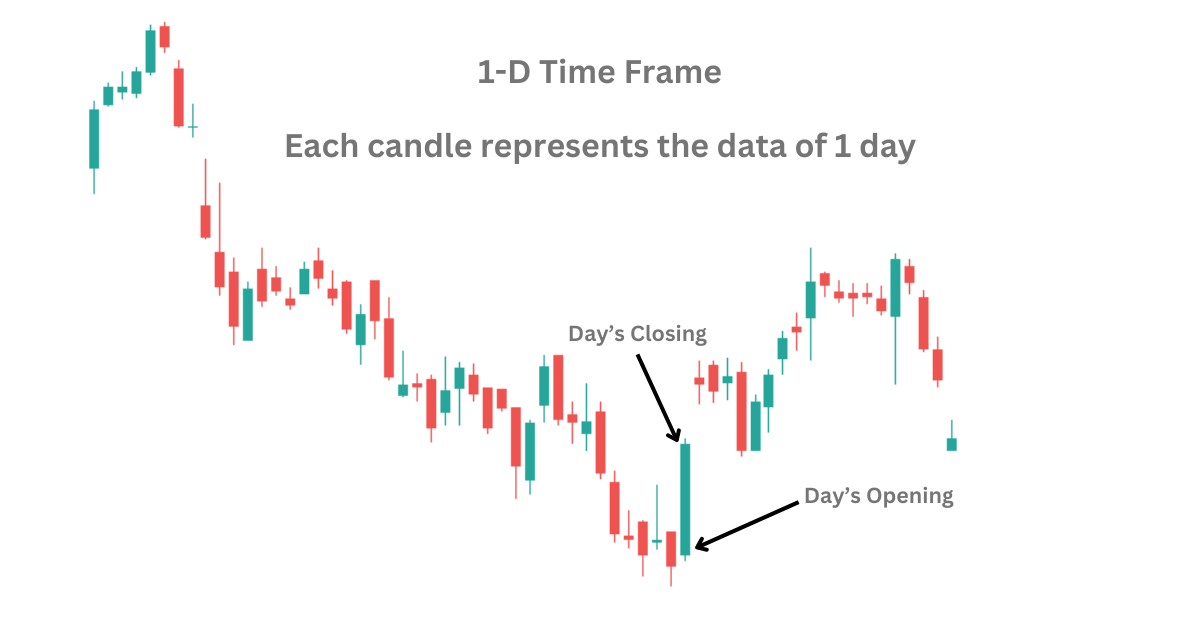
A time frame refers to the specific duration each candlestick or bar on a price chart represents, showing the stock’s price movement during that period (e.g., 5-minute, 1-hour, or 1-day time frames).
For example, a 1-day time frame indicates the day’s high, low, opening, and closing prices, represented by a single candlestick. The image below will help you to understand it better.

Now that we understand what a time frame is in trading, let’s explore why it’s so crucial for making successful trades.
Why do Time frame matter in trading?
Since, each time frame provides unique information and perspectives, it helps traders determine the best entry and exit points based on their goals. For instance, Intraday traders often rely on shorter time frames such as 5-minute and 15-minute charts, which help them make quick decisions. Meanwhile, long-term investors look at daily or weekly time frames to analyze trends and price movements over months or even years.
Trading becomes easier for traders, as the short-term time frames help predict immediate market movements and price fluctuations. Whereas, The long-term time frames reveal the broader market trend that assists long-term investors in making informed decisions.
How to Choose the Right Time Frame?
When choosing a chart time frame, traders should begin by setting clear goals and objectives for their trade. Many traders struggle with this step and often enter trades without a proper strategy or plan. Some focus only on short-term price fluctuations, taking entries based on immediate moves, while ignoring the broader market outlook. This can result in trade failure.
For example, imagine a breakout occurs on a 5-minute chart, where the price rises above a resistance level, suggesting a potential buying opportunity. However, when you check the 15-minute chart, the breakout doesn’t hold. Instead, the price quickly pulls back, and the resistance level remains intact. This could indicate a false breakout on the shorter time frame, which might lead to a poor trade entry. The 15-minute chart provides a clearer picture, showing that the price has not yet confirmed a sustained move above resistance. What seemed like a breakout on the 5-minute chart could simply be a temporary fluctuation rather than a real trend reversal.
This is why it’s crucial to check slightly longer time frames to confirm the validity of a breakout. This simple step can help traders avoid mistakes and improve the accuracy of their decisions.
Multiple Time Frames (Top-Bottom Analysis):
In trading, selecting the right chart duration is crucial for developing effective strategies, as different duration highlight unique market trends and behaviors. To build a clearer approach, let’s explore how longer duration can complement shorter chart duration in making better trading decisions.
When using multiple time frames, traders often adopt a top-down approach to analyze the broader trend before zooming in on specific entry points.
| Trading Type | Time Frame |
|---|---|
| Long-Term | 1-Month, 1-Week |
| Medium-Term | 1-Week |
| Short-Term | 1-Day, 4-Hours |
| Intraday | 1-Hour, 15-Min, 5-Min |
| Scalping | 5-Min, 1-Min |
Long-Term Time Frames (1-W, 1-Month):
Traders often ignore long-term charts but it is highly valuable for investors who focus on months or years instead of quick trades. These charts help determine if the market is trending up, down, or moving sideways. This broader perspective is especially useful for investors as it highlights key support and resistance levels and major price movements.. Unlike traders, investors rely not just on technical analysis but also on fundamental factors. This approach helps them make more informed decisions and increases the likelihood of long-term gains. However, this strategy is unsuitable for short-term traders looking for quick results.
Medium-Term Time Frames (1-W):
After identifying the overall trend, weekly charts help refine your understanding. This chart is useful for swing traders looking for an opportunity to hold the trade for a few weeks to months. Patterns like reversals or continuations can confirm the direction observed in the broader analysis.
Short-Term Time Frames (1-D, 4-Hour)
Using a top-down approach, traders can combine long-term, medium-term, and short-term charts. Start with the long-term to set the context, then move to medium-term for trade setup, and finally use short-term charts to time entries and exits accurately. This method provides a holistic view of the market and minimizes risks. Short-term charts, like daily or 4-hour time frames, are then used to find more precise setups. Traders analyze these charts to look for breakouts, pullbacks, or consolidation patterns within the broader trend. This time frame is ideal for those planning trades that last from a few day to a week.
Intraday Time Frames (1-H, 15-Min, 5-Min)
For day traders, choosing the right chart duration is crucial to identifying the best entry and exit points. To start, it’s important to first check the overall trend on a daily chart, as this provides the broader market context. Once the larger trend is understood, you can zoom in on shorter time frames like 1-hour, 15-minute, and 5-minute charts to capture smaller price movements and pinpoint key levels such as support, resistance, or breakouts. By aligning these shorter-term signals with the bigger trend, traders can reduce the risk of false signals and make more informed, accurate decisions.
Scalping Time Frame (5-Min, 1-Min)
Scalpers rely on very short views, such as 1-minute or 5-minute charts, to act on quick price changes. Even for these rapid trades, starting with an analysis of larger charts ensures alignment with the overall trend and reduces risk.
Common Mistakes to Avoid with Time Frame:
To make a trade successful, One should avoid making errors while choosing the chart duration for analyzing the Stock/Market. One common error a trader makes is, giving more attention to the short-term charts without considering the longer-term trends. Which may lead to poor trade decisions.
Another mistake traders make is, jumping between different time duration often without clear strategy, creating confusion, and missed opportunities. Traders often take trades based on the breakout on short term trades without the confirmation on longer-term chart duration, which results in false entries. It is also crucial not to jump from one duration to another duration as, this can lead to indecision. For better results, always align your chosen chart duration with your trading goals and stick to a consistent approach.
Conclusion:
We’ve seen that the time frame you choose plays a significant role in shaping your trading style. Selecting the right time frame is essential because it provides a clear view of market trends and helps pinpoint the best entry and exit points for trades. Ultimately, choosing the right time frame is a key step in developing a strategy that aligns with your trading style and personal goals.
FAQs:
Q. : What is trading time frame is best?
Ans:- 1-D and 1-W frames are the best, since these frames shows the broader market direction as well as these frames are less volatile compared to short term frames.
Q. Which time frame is best for intraday?
Ans: the 5-Min and 15-Min frames are considered as the best frames for day trading. 15-Min frame provides broader market direction for intraday trading.
Know someone who’d find this useful? Share it with them!


